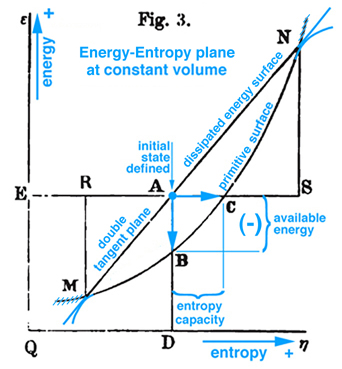
Figure 1. Gibbs Fig. 3, pg. 402, Part2 of Ref.[1], Gibbs original free energy diagram exists in the energy-entropy plane, which Gibbs actually labeled as "available energy".
Gibbs was the first to offer an explanation of thermodynamic processes associate with triple point based on a graphical method developed in his first two publications, Ref.[1]. However Maxwell was the first to actually draw Gibbs' three-dimensional energy surface which he uses to elaborate on the initial explanation offered by Gibbs, Ref.[2]. By studying Maxwell's three-dimensional energy-entropy-volume surface with lines of temperature and pressure scribed onto this surface, it is possible to understand how a substance can coexist in three different physical states, e.g. gas, liquid, and solid (triple point) and how to determine whether a substance in this mixed state will tend of itself to pass from one of these states to the other.
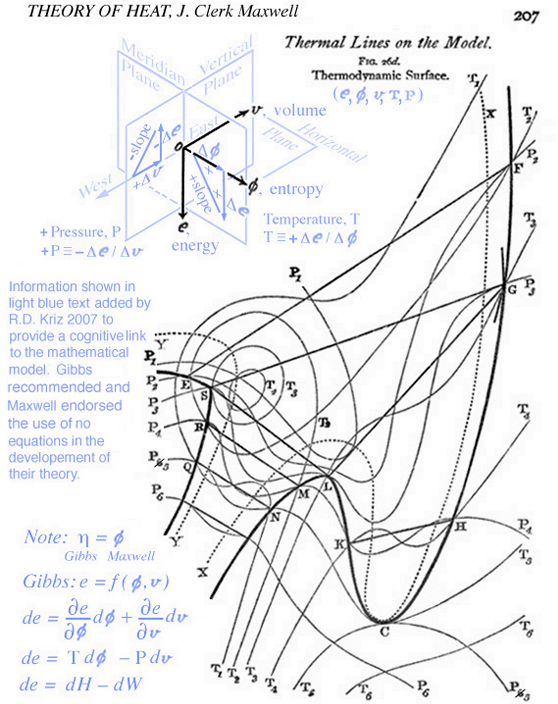
Maxwell developed a very clear explanation of thermodynamic processes associated with the triple point mixed state, pp. 195-208, together with Figs. 26b, 26c, and 26d, Ref.[2]. The available energy shown in Fig. 1 (Gibbs Fig. 3, pg. 402), Ref.[1], is described by Maxwell as negative the energy gained by the whole system necessary for a substance in a mixed state to tend of itself to pass from one state to another, see Fig. 2 (Maxwell Fig. 26b) . Today this energy is referred to as free energy. In Fig. 1 Gibbs develops the graphical relationship between available energy and entropy capacity in the energy-entropy plane at a constant volume, whereas Maxwell in Fig. 2 (Maxwell Fig. 26b) and Fig. 3 (Maxwell Fig. 26c) draws the energy axes downwards where the horizontal axis in these two figures can be either volume, increasing to the left, or entropy, increasing to the right. Maxwell also clearly describes stable and unstable regions associated with the triple point that exist along the curve in Fig. 3 (Maxwell Fig. 26c), Ref.[2]. It is interesting Maxwell did not use Fig. 1 (Gibbs Fig. 3, Ref.[1]), but developed the same relationship graphically using Fig. 2 (Maxwell Fig. 26b, Ref.[2]) that shows the curvature of the primitive energy surface below the tangent plane (dissipated energy surface) concave in the negative energy axes direction. Maxwell's figures are based on Gibbs' description, pp. 400-404, Ref.[1], where the curvature shown in Fig.1 (Gibbs, Fig. 3, Ref[1]) is oriented in the opposite direction, although Maxwell never mentions this, but simply draws his own figures shown here as Fig.s 2 and 3. Unlike Gibbs, Maxwell's Fig. 26b, Ref.[2], can be projected either into the energy-volume or energy-entropy planes. In either case both of these planes intersect the three-dimensional energy-entropy-volume surface which Gibbs refers to as the "primitive" energy surface which provides a fundamental understanding in a graphical sense. Indeed this three-dimensional surface provides the fundamental graphical basis for understanding the thermodynamic process in either plane where energy is a function of entropy, volume, temperature and pressure. Because a graphical basis for a fundamental understanding was emphasized by Gibbs, Maxwell was compelled to draw Gibbs' three-dimensional fundamental (primitive) surface with lines of constant temperature and pressure scribed onto this surface, see also Fig. 4 (Maxwell Fig. 26d). How Maxwell uses this figure, together with Fig.s 2 and 3, to explain triple point thermodynamic processes is reconstructed and discussed here in detail.
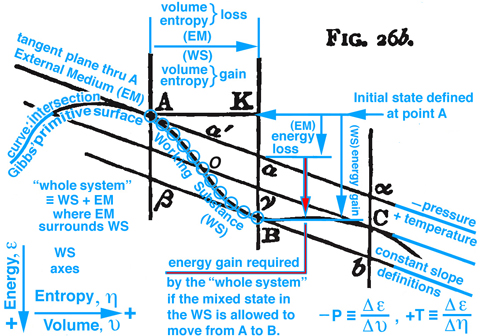
Figure 2. Maxwell Fig. 26b, pg. 199, Ref.[2], is used to describe an energy exchange between the external medium (EM) and working substance (WS) contained within an insolated whole system that projects into the energy-volume and energy-entropy plane.
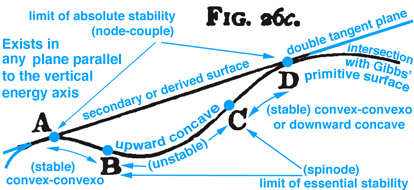
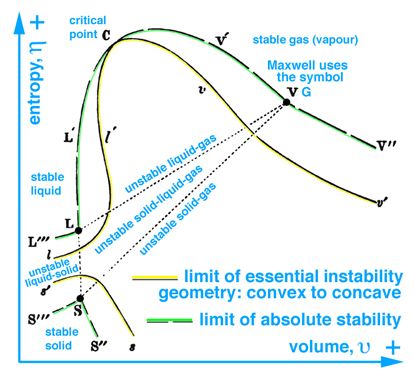
Figure 3. Maxwell Fig. 26c, pg. 204, Ref.[2], describes stable and unstable processes associated with the double curvatures that exist along Gibbs' "primitive" energy surface.
The idea of free or available energy was developed by Gibbs to explain thermodynamic process associated with the triple point and critical point phenomena. Maxwell elaborated on explaining the relationship between triple point and thermodynamic processes assoicated with Gibbs "primitive" and "dissipated" three-dimensional energy surfaces as an example for students who prefer specific examples. Indeed in Maxwell's preface, "Theory of Heat", Ref.[2], he explains that his book is written for students. Consequently Maxwell develops the fundamental thermodynamic ideas related to triple point and available energy in great detail and attempts to draw Gibbs' three-dimensional "primitive" and "dissipated" energy surfaces, fig.26d. The discussion here continues with a recommendation to read Maxwell prior to reading Gibbs, and prior to reading Maxwell a thorough review of basic undergraduate reversible thermodynamic concepts is necessary because Maxwell uses different names for the same concepts used today, e.g. reversible Thermal Energy Reservoir (TER) and reversible Mechanical Energy Reservoir (MER) associated with a closed system and a control mass. After studying Maxwell, it should be clear that Gibbs' available energy can only be understand in the context of triple point and that available energy can not be understood by simply observing a change of energy between Gibbs' "primitive" and "dissipated" energy surfaces projected into the energy-entropy plane, in fig. 3, p. 402, Ref.[1].
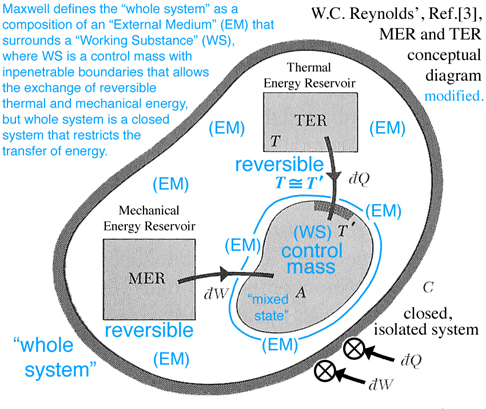
The TER and MER concepts shown in Fig. 5 below are reversible processes that surround and interact with region A, which is modeled as a control mass, e.g. no mass can enter or leave region A. Together the control mass and the surrounding environment constitute a combined region C, which is an isolated system where no heat can be transferred to or work done on C. Hence the label C invokes both the idea of a "C"losed system and that this system is a "C"omposition of an environment that surrounds a control mass. In the discussion that follows the triple point, mixed state of solid-liquid-gas, is modeled as a control mass confined to region A and labeled by Maxwell as a "Working Substance (WS)". The environment enclosing region A is labeled by Maxwell as the "External Medium (EM)". How the MER and TER thermodynamic processes, that exist within the EM, interact with the mixed state, that exists as a control mass, determines whether the WS in region A will tend of itself to pass from one of these states to the other without the influence of external work acting on or thermal energy transferred to the closed system, or what Maxwell refers to as the "whole system", e.g. the combined region C is an isolated system.
It is interesting to note that in the 1870s fundamental thermodynamic concepts were still being introduced and openly debated, e.g. the correct implementation of the idea of entropy that was first introduced by Clausius (1850s) but Rankine independently labeled the idea of entropy as his thermodynamic function. Gibbs had an all together different approach where entropy and volume are thought of as independent variables and energy was modeled as a function of entropy and volume, not temperature and pressure which are slopes tangent at a point on the "primitive" energy surface. This idea was developed by Gibbs primarily as a graphical method, but also analytically as Gibbs' equation of state, which we use to this day for quantitative design purposes. An excellent sumary of this debate is discussed by Martin J. Klein from a historical perspective, Ref.[4]. Although instructive, this debate is avoided here where the discussion that follows focuses on how Gibbs' concept of free energy was used by Maxwell to explain how a working substance can exist in a mixed state of solid, liquid and gas, and whether this substance will tend of itself to pass from one of these states to the other without the influence of heat transferred to or external work done on the isolated "whole system". It is interesting that Maxwell developed this idea graphically not analytically as recommended by Gibbs. This however does not subtract from the fact that we still need an analytic approach to accomplish a quantitative design by using the differential equation of state. Because some of the terminology associated with current day reversible thermodynamic concepts are different from the terminology used in the 1870s, readers are encouraged to make their own connection with the terminology they learned in their undergraduate thermodynamics classes with that used by Maxwell. In the discussion below are some of my own thoughts that I hope will prove useful while the reader studies Maxwell Ref.[2], where reference is also made both with respect to analytic concepts developed by W.C. Reynolds, Ref.[3], which is the textbook I used as an undergraduate, as well as graphical concepts developed in the previous section "Thermodynamic Case Study: Gibbs' Thermodynamic Graphical Method". Sometimes graphical and analytic methods coincide and enhance our understanding of complex ideas that can not always be explained with either just images or math.
Here the words "this model" are referring to the concepts used to construct the three-dimensional model shown in Fig. 4 (Maxwell Fig. 26d). These concepts are carefully developed graphically in the previous section Thermodynamic Case Study: Gibbs' Thermodynamic Graphical Method".
On pg. 198, fifth paragraph: The Working Substance (WS) placed in a cylinder is the same idea as the control mass in Fig. 5 (Reynolds' Fig. 7.13) with impenetrable boundaries and the idea of a moving piston is fundamental to the reversible MER concept. This idea of a moving piston is used again on pg. 199, where the volume associated with the EM and WS is exchanged, "Also the one gains in volume what is lost by the other", without exchanging mass. The idea of volume exchange is highlighted in blue in Fig. 2 (Maxwell Fig. 26b). This idea would however result in a change in density and pressure. But since the temperature and pressure must remain constant, Maxwell explains the extent of the EM surrounding the WS must be so great that, "... its pressure and temperature are not sensibly altered by the changes of volume of the working substance ...". This idea of what is gained by one is given up or lost by the other is extended to other properties associated with the EM and WS, pg. 198, "... consider it as part of the model representing the external medium, this model being so placed that the volume, entropy, and energy are reckoned in the opposite directions from those in the model of the working substance." These ideas are envisioned in Fig. 2 (Maxwell Fig. 26b). Gibbs used this same visual thinking in Fig. 1 (Gibbs Fig.3) where available energy is graphically related to entropy capacity, or what Reynolds', Ref.[3], calls entropy production. Comment: Studying Gibbs and Maxwell helped me better understand the concept of entropy production that I first learned in Reynolds, Ref.[3] as an undergraduate.
The discussion continues where it is now possible to show that Gibbs' concept of "available" energy and Maxwell's concept of "energy gained by the whole sytsem", is the same concept as "free energy" that is used today. Returning to Fig. 2 (Maxwell Fig. 26b) by definition the curve (Gibbs' primitive surface) that connects points A, B, and C all exist at the same temperature, since the rate of change of energy with respect to a change in entropy must be constant in the Energy-Volume plane, and the same pressure also exist at these same points because they all have the same slopes, i.e. by definition negative pressure is the rate of change of energy with respect to volume. These ideas are highlighted in light blue in Fig. 2 (Maxwell Fig. 26b). A similar discussion is made by Maxwell using this figure in the energy-entropy plane where the slopes are temperature.
Figure 2. Maxwell Fig. 26b, pg. 199, Ref.[2] is repeated here to facilitate the discussion in the paragraphs above and below.
Figure 2 (repeated). is used to describe an energy exchange between the external medium (EM) and working substance (WS) contained within an insolated whole system that projects into the energy-volume and energy-entropy plane.
Imagine the physical state of the WS at point A is solid and interacts with EM, that surrounds it, such that it transforms the solid into a mixed state of solid-liquid-gas as it moves to point B. Initially both EM and WS exist in the same state at point A. However because EM is massive, it maintains a constant temperature as it interacts with WS and moves into a new state away from point A but must maintain its position in the tangent plane as WS follows the "primitive" energy surface that is required to pass from A to B through a series of states represented by the blue circles along the curve shown in Fig. 2 (Maxwell Fig. 26b) . This curve moves along a line of constant temperature or pressure similar to the red or blue lines scribed onto the clay and plaster model which is also shown in Fig. 26d and labeled as a constant temperature. The incremental change in energy, de, along the vertical axis can be envisioned as a glyph which is modeled in general as a total differential of function of two independent variables which is equivalent to taking the dot product of the gradient of the function of two independent variables with the differential positon vector connecting two successive points, e.g. blue circles along the constant temperature curve in Fig. 26b. Because EM and the WS are at the same temperature, when projected into the energy-entropy plane where entropy is the horizontal axes, the entropy lost by one is gained by the other, and the same can be said for volume when Fig. 2b is projected into the energy-volume plane where the horizontal axis is volume and the slope requires a constant pressure. Hence as WS passes from A to B, the EM is restricted to its tangent plane and must intersect the vertical line at point a, which visually links the state of WS at point B with EM at point a.
Since WS and EM coexist along the vertical line intersecting points a and B, it is deduced graphically that the line K-B is associated with the WS energy gain and the line K-a with EM energy loss. The difference between WS and EM is the amount of energy required to change some of the solid into liquid and gas to create a mixed state for WS at point B. This energy must be in the form of heat transferred to or work done on the "whole system" or could be in the form of a chemical reaction within this system which is isolated. However since the "whole system" is modeled as an isolated system without chemical reations where no heat can be transferred to or work done on the isolated system, it is NOT possible, that in this configuration, WS will pass of itself from state A to B unless energy can somehow be added to the "whole system"or sometimes just the word "system" is used. Comment: It is important to understand the difference WS and EM as components of the "whole system" when energy is discussed, which requires the reader carefully study Maxwell's description, pp. 198-202 together with understanding the MER and TER concepts in Fig. 5. Since this energy is not freely available by the "whole system", this thermodynamic process can NOT occur. It is in this sense that Gibbs uses the concept of "available" energy or in today's rhetoric the word "freely" available or simply just "free" energy is now used. However if the initial state is the mixed state at point B it can be shown that WS can of itself pass through a series of states to point A and the energy required to pass from B to A is freely available. These and other configurations are discussed by Maxwell. Recall the case discussed above, where energy is not freely available to support a thermodynamic process from point A to B -- for this case energy resulting from a chemical reaction within the isolated system could be used as the energy necessary (freely available) to support this thermodynamic process, which is a topic expanded on in Gibbs' next publication.
Other interesting triple point thermodynamic processes are developed graphically by Maxwell but not discussed here. Some processes can be "explosive" when components of EM and WS not associated with consecutive blue circles on the "primitive" energy surface come into direct contact. Again the diagram provides a cognitive basis for realizing new relationships. Thermodynamic reversible processes associated with stable and unstable regions that exist below the "dissipated" energy surface, i.e. tangent plane, are discussed in the next section.
When information in the energy-entropy plane (Fig. 1), energy-volume plane (Fig. 2), and entropy-volume plane (Fig. 3) is combined with colors originally proposed by Maxwell in a letter to James Thomson 8 july 1875, Ref.[5], it is much easier to understand the visual thinking Gibbs used in the construction of the three-dimensional "primitive" energy surface. Note: the energy surface is three-dimensional when thinking in terms of cartesian coordinates, however the energy surface is a two-dimensional function of entropy and volume. Hence Fig. 6 does not reveal a functional relationship, but is used to reveal stable-unstable regions that are projected upwards onto the "primitive" energy surface above the entropy-volume plane.
The concept of visual thinking in a scientific context is lacking in today's definition and implementation of Scientific Visualization, which is evident by the comments made by panel members and authors of publications that raise the question, "Is there science in visualization?". Typically these panel discussions do not include scientists, but rather the community that leads these discussions are computer scientists who typically lack the ability to grasp the scientific context, e.g. to read and understand the thermodynamic graphical methods published by Gibbs and Maxwell. At best this community understands and consequently reports Maxwell's graphical model in an anecdotal context that can not be reproduced in a scientific sense.
After studying and understanding the relationship of reversible thermodynamic process associated with triple point as originally developed by Gibbs and further developed by Maxwell, it is useful to compare the Gibbs' and Maxwell's original graphical methods and models in a scientific context with the today's popular two-dimensional (pressure and temperture) diagrams used to explain triple point and associated thermodynamic process in Fig. 7. Recall Gibbs recommendation p. 309, Ref.[1], to avoid using pressure or temperature as axes in figures used to understand reversible thermodynamic processes.
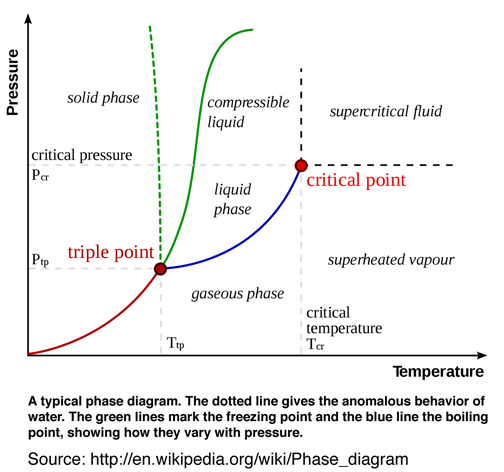
Clearly Gibbs' and Maxwell's graphical method is superior because it leads to a fundamental understanding of the thermodynamic theory of state as it relates to triple point, Gibbs' "available" free energy, and many other significant thermodynamic process, e.g. critical point. It is rather amazing that unlike other original scientific theories, the thermodynamic theory of state as originally developed by Gibbs and endorsed and futher developed by Maxwell has essentially been abandoned. An extensive literature review reveals that since 1873 only a few researchers studied, understood, and endorsed Gibbs' original graphical method who emphasized it is preferable "to arrive, for example, at the conception of energy, of entropy, of absolute temperature, in the construction of the diagram without the analytical definitions of these quantities", Ref.[1]. Gibbs' emphasis of his graphical method and avoiding his own equation of state, when understanding the relationship between thermodynamics properties, is perhaps too much to ask of today's researchers and educators. When the word relationship is used today, it means a mathematical relationship, not in the sense Gibbs and Maxwell envisioned as a graphical method.
Gibbs' graphical method using surfaces "... without the aid of analytical formulae, ..." is a rare if not confusing idea. And so we will most likely continue to use our familiar QWERTY keyboards and triple point phase diagrams using pressure and temperature as axes, even though we know there are more efficient keyboards and more insightful graphical methods using three-dimensional surfaces with triple point tangent planes that provide a fundamental understanding of the relationship between the thermodyanmic state variables. I would however not recommend introducing Gibbs' graphical method into the undergraduate curriculum for the same reason I would not recommend abandoning the use of the QWERTY keyboard. It would be too confusing. I would however challenge members of the scientific community and members of the visualization community, who consider themselves to be scientists, to STUDY Gibbs' and Maxwell's original contribution, rethink the thermodynamic theory of state as a graphical method, and abandon the idea that this graphical method only has value as a visual aid or that Maxwell's insightful creation of his clay and plaster model is at best an anecdotal experience. This community of open minded scientists, researchers, and educators will, when appropriate, also change the curriculum. However this change must first occur as a fundamental concept. Otherwise it just becomes a graphical TECHNIQUE or visual aid that is used for pedogogical purposes and the fundamental understanding proposed by Gibbs as a graphical METHOD is not realized. Such a change would require a cultural change in the way researchers understand and educators teach Gibbs' theory of state.