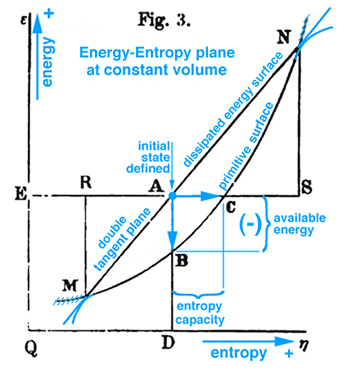
Figure 1. Gibbs Fig. 3, pg. 402, Part2 of Ref.[1], Gibbs original free energy diagram, which Gibbs actually labeled as available energy.
Gibbs was the first to offer an explanation of thermodynamic processes associate with triple point based on a graphical method developed in his first two publications, Ref.[1]. However Maxwell was the first to actually draw Gibbs' three-dimensional energy surface which he uses to elaborate on the initial explanation offered by Gibbs, Ref.[2]. By studying Maxwell's three-dimensional energy-entropy-volume surface with lines of temperature and pressure scribed onto this surface, it is possible to understand how a substance can coexist in three different physical states, e.g. gas, liquid, and solid (triple point) and how to determine whether a substance in this mixed state will tend of itself to pass from one of these states to the other.
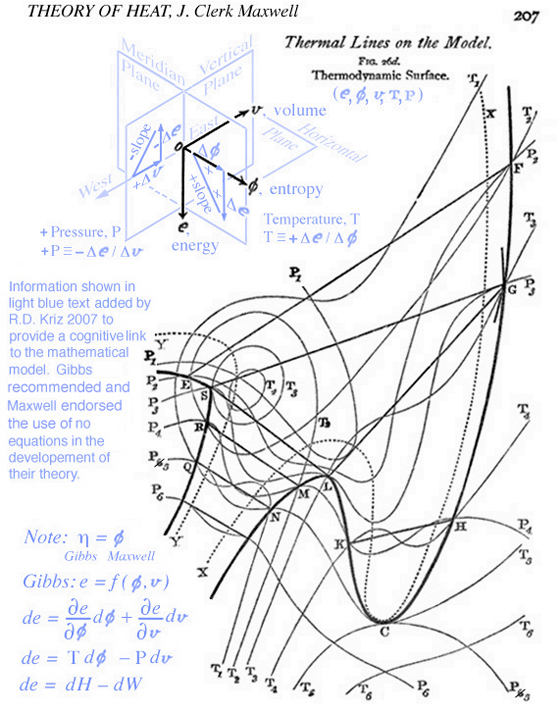
Maxwell developed a very clear explanation of thermodynamic processes associated with the triple point, pp. 195-208, together with Figs. 26b, 26c, and 26d, Ref.[2]. The available energy shown in Fig. 1 (Gibbs Fig. 3, pg. 402), Ref.[1], is described by Maxwell as the energy gained by the whole system necessary for a substance in a mixed state to tend of itself to pass from one state to another, see Fig. 2 (Maxwell Fig. 26b). Today this energy is referred to as free energy. In Fig. 1 Gibbs develops the graphical relationship between available energy and entropy capacity in the energy-entropy plane at a constant volume, whereas Maxwell in Fig. 2 (Maxwell Fig. 26b) and Fig. 3 (Maxwell Fig. 26c) elaborates on stable and unstable regions associated with the triple point that exist along the curve in the energy-volume plane at a constant entropy. In either case these planes intersect the three-dimensional energy-entropy-volume surface which Gibbs refers to as the "fundamental" or "primitive" surface. Indeed this three-dimensional surface provides the fundamental graphical basis for understanding the thermodynamic process in either plane where energy is a function of entropy, volume, temperature and pressure. It is interesting that Gibbs and Maxwell develop this relationship graphically. Because a graphical basis for a fundamental understanding was emphasized by Gibbs, Maxwell was compelled to draw the three-dimensional fundamental (primitive) surface described by Gibbs but never drawn, see Fig. 4 (Maxwell Fig. 26d).
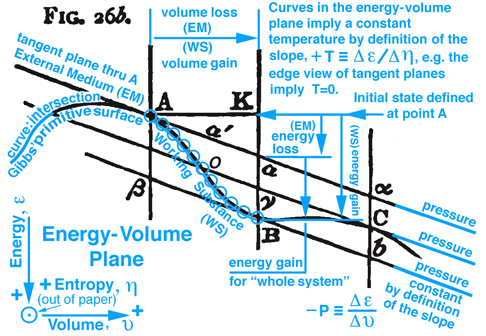
Figure 2. Maxwell Fig. 26b, pg. 199, Ref.[2], describes in general an energy exchange between and external medium (EM) and a working substance (WS) for an insolated system.
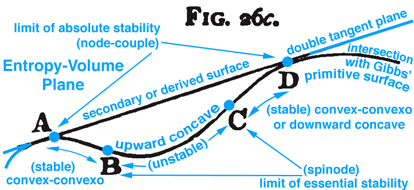
Figure 3. Maxwell Fig. 26c, pg. 204, Ref.[2], describes stable and unstable processes associated with the double curvatures that exist along Gibbs' "primitive" surface.
The idea of free or available energy is developed by Gibbs in more general context whereas Maxwell uses the specific example of triple point, which perhaps helps students who prefer specific examples. Indeed in Maxwell's preface, "Theory of Heat", Ref.[2], he explains that this is a text book written for students. Hence the discussion here continues with a recommendation, that a review of basic undergraduate reversible thermodynamic concepts associated with the triple point is necessary because, as demonstrated in the creation of the figures above, Maxwell uses different names for the same concepts used today, e.g. reversible Thermal Energy Reservoir (TER) and reversible Mechanical Energy Reservoir (MER) associated with a closed system and a control mass.

The TER and MER concepts shown in Fig. 5 above are reversible processes that surround and interact with region A, which is modeled as a control mass, e.g. no mass can enter or leave region A. Together the control mass and the surrounding environment constitute a combined region C, which is an isolated system where no heat can be transferred to or work done on C. Hence the label C invokes both the idea of a Closed system and that this system is a Composition of an environment that surrounds a control mass. In the discussion that follows the triple point, mixed state of solid-liquid-gas, is modeled as a control mass confined to region A and labeled by Maxwell as a "Working Substance". The environment enclosing region A is labeled by Maxwell as the "External Medium". How the MER and TER thermodynamic processes, that exist within the external medium, interact with the mixed state, that exists as a control mass, determines whether the working substance in region A will tend of itself to pass from one of these states to the other without the influence of external work acting on or thermal energy transferred to the closed system, or what Maxwell refers to as the "whole system", e.g. the combined region C is an isolated system.
It is interesting to note that in the 1870s fundamental thermodynamic concepts were still being introduced and openly debated, e.g. the "correct" implementation of the idea of entropy that was first introduced by Clausius (1850s) but Rankine independently labeled the idea of entropy as his "thermodynamic function". Gibbs had an all together different approach where entropy and volume are thought of as independent variables and energy was modeled as a function of entropy, volume, temperature, and pressure. This idea was developed by Gibbs primarily as a graphical method, but also analytically as Gibbs' equation of state, which we use to this day for quantitative design purposes. Although instructive, this debate is avoided here where the discussion that follows focuses on how Gibbs' concept of free energy was used by Maxwell to explain how a working substance can exist in a mixed state of solid, liquid and gas, and whether this substance will tend of itself to pass from one of these states to the other without the influence of heat transferred to or external work done on the isolated "whole system". It is interesting that Maxwell developed this idea graphically not analytically as recommended by Gibbs. This however does not subtract from the fact that we still need an analytic approach to accomplish a quantitative design by using the equation of state. Because some of the terminology associated with current day reversible thermodynamic concepts are different from the terminology used in the 1870s, readers are encouraged to make their own connection with the terminology they learned in their undergraduate thermodynamics classes with that used by Maxwell. In the discussion below are some of my own thoughts that I hope will prove useful while studying Maxwell Ref.[2]. In the discussion that follows reference is made both with respect to analytic concepts developed by W.C. Reynolds, Ref.[3], which is the textbook I used as an undergraduate, as well as graphical concepts developed in the previous section Thermodynamic Case Study: Gibbs' Thermodynamic Graphical Method". Sometimes graphical and analytic methods coincide and enhance our understanding of complex ideas that can not always be explained with either just images or math.
Here the words "this model" are referring to the concepts used to construct the three-dimensional model shown in Fig. 4 (Maxwell Fig. 26d). These concepts are carefully developed graphically in the previous section Thermodynamic Case Study: Gibbs' Thermodynamic Graphical Method".
On pg. 198, fifth paragraph: The Working Substance (WS) placed in a cylinder is the same idea as the control mass in Fig. 5 (Reynolds' Fig. 7.13) with impenetrable boundaries and the idea of a moving piston is fundamental to the reversible MER concept. This idea of a moving piston is used again on pg. 199, where the volume associated with the EM and WS is exchanged, "Also the one gains in volume what is lost by the other", without exchanging mass. The idea of volume exchange is highlighted in blue in Fig. 2 (Maxwell Fig. 26b). This idea would however result in a change in density and pressure. But since the temperature and pressure must remain constant, Maxwell explains the extent of the EM surrounding the WS must be so great that, "... its pressure and temperature are not sensibly altered by the changes of volume of the working substance ...". This idea of what is gained by one is given up or lost by the other is extended to other properties associated with the EM and WS, pg. 198, "... consider it as part of the model representing the external medium, this model being so placed that the volume, entropy, and energy are reckoned in the opposite directions from those in the model of the working substance." These ideas are envisioned in Fig. 2 (Maxwell Fig. 26b). Gibbs used this same visual thinking in Fig. 1 (Gibbs Fig.3) where available energy is graphically related to entropy capacity, or what Reynolds', Ref.[3], calls entropy production. Comment: Studying Gibbs and Maxwell helped me better understand the concept of entropy production that I first learned in Reynolds, Ref.[3] as an undergraduate.
The discussion continues where it is now possible to show that Gibbs' concept of "available" energy and Maxwell's concept of "energy gained by the whole sytsem", is the same concept as "free energy" that is used today. Returning to Fig. 2 (Maxwell Fig. 26b) by definition the curve (Gibbs' primitive surface) that connects points A, B, and C all exist at the same temperature, since the rate of change of energy with respect to a change in entropy must be constant in the Energy-Volume plane, and the same pressure also exist at these same points because they all have the same slopes, i.e. by definition pressure is the rate of change of energy with respect to volume. These ideas are highlighted in light blue in Fig. 2 (Maxwell Fig. 26b).
Imagine the physical state of the WS at point A is solid and at point B WS exists in a mixed state of solid, liquid, and gas. Initially both EM and WS exist in the same state at point A. Now suppose WS passes from A to B through a series of states represented by the blue circles along the primitive surface curve shown in Fig. 2 (Maxwell Fig. 26b). Since the EM and the WS are at the same temperature, the entropy lost by the one is gained by the other and the same can be said for the volume. Again reversible MER and TER concepts are used. Hence as WS passes from A to B, the EM is restricted to its tangent plane and must intersect the vertical line at point a, which visually links the state of WS at point B with the EM surrounding the WS. Note WS and EM coexist along the vertical line that intersect points a and B, where it is observed graphically that, since WS and EM exist at the same volume, temperature, pressure, and entropy, then the energy of WS and EM must be different. This difference in energy for WS and EM is deduced graphically where the line K-B is visually associated with the WS energy gain and the line K-a with EM energy loss. The difference between WS and EM is the amount of energy required to change some of the solid into liquid and gas to create a mixed state for WS at point B. This energy must be in the form of heat transferred to or work done on the "whole system" or could be in the form of a chemical reaction within the isolated system. However since the "whole system" is modeled as an isolated system without chemical reations where no heat can be transferred to or work done on the isolated system, it is NOT possible, that in this configuration, WS will pass of itself from state A to B unless energy can be added. Since this energy is not freely available this thermodynamic process can not occur. It is in this sense that Gibbs uses the concept of "available" energy or in today's rhetoric the word "freely" available or simply just "free" energy is used. However if the initial state is the mixed state at point B it can be shown that WS can of itself pass through a series of states to point A and the energy required to pass from B to A is freely available. These and other configurations are discussed by Maxwell. Recall the case discussed above, where the energy is not freely available to support a thermodynamic process from point A to B, for this case energy resulting from a chemical reaction within the isolated system could be used as the energy necessary (freely available) to support this thermodynamic process.
Other interesting triple point thermodynamic processes are developed graphically by Maxwell but not discussed here. Some of these processes can be sudden or "explosive". Processes associated with stable and unstable regions that exist below the developed surface tangent planes are discussed in the next section.
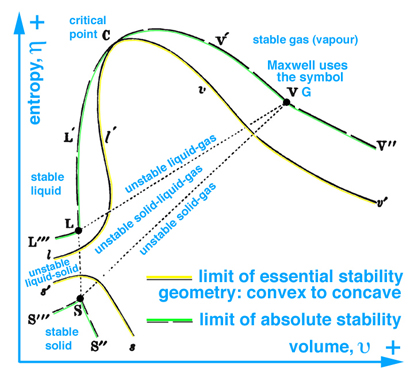
When information in the energy-entropy plane (Fig. 1), energy-volume plane (Fig. 2), and entropy-volume plane (Fig. 3) is combined with colors originally proposed by Maxwell in a letter to James Thomson 8 july 1875, Ref.[4], it is much easier to understand the visual thinking Gibbs used in the construction of the three-dimensional fundamental (primitive) surface. Note: the energy surface is three-dimensional when thinking in terms of cartesian coordinates, however the energy surface is a two-dimensional function of entropy and volume. Hence Fig. 6 does not reveal a functional relationship, but is used to reveal stable-unstable regions that are projected upwards onto the energy surface above the entropy-volume plane.
The concept of visual thinking in a scientific context is lacking in today's definition and implementation of "Scientific Visualization", which is evident by the comments made by the panel members and authors of publications that raise the question, "Is there science in visualization?". The question is rhetorically no, because this community lacks the necessary scientific context, or else they wouldn't be asking the question. The answer should be yes, followed by, here let me show you an example. Typically these panel discussions do not include scientists, but rather the community that leads these discussions are computer scientists who lack the ability to grasp the scientific context, e.g. to read and understand the thermodynamic graphical methods published by Gibbs and Maxwell. At best this community has reported Maxwell's diagrams in an anecdotal context that can not be reproduced in a scientific sense and so why bother. Obviously since this is at best anecdotal perhaps there is an opportunity to focus on the esthetic/artistic aspects of images. Different points of view are based on different definitions and implementation of "Scientific Visualization".
It's all about expectations of your audience -- their definitions and experience in implementing graphical tools in their research. For example, if I gave a seminar entitled, "Scientific Visualization Without Graphical Tools or Data", for sure the scientific community would not attend and I doubt the computer science community interested in developing graphics tools to analyze data would attend. However, if I gave a seminar entitled, "Scientific Visualization Case Study: Development of the Thermodynamic Theory of State as a Graphical Method", perhaps some from the scientific community would attend but again computer scientists interested in graphical tools and data would not. In the minds of the scientific community and the computer science graphics community this creative visual thinking exists but at best it is anecdotal, which cannot be reproduced in a scientific sense. --- ? --- Not true.